Experiment Window

Placeholder Image

Field

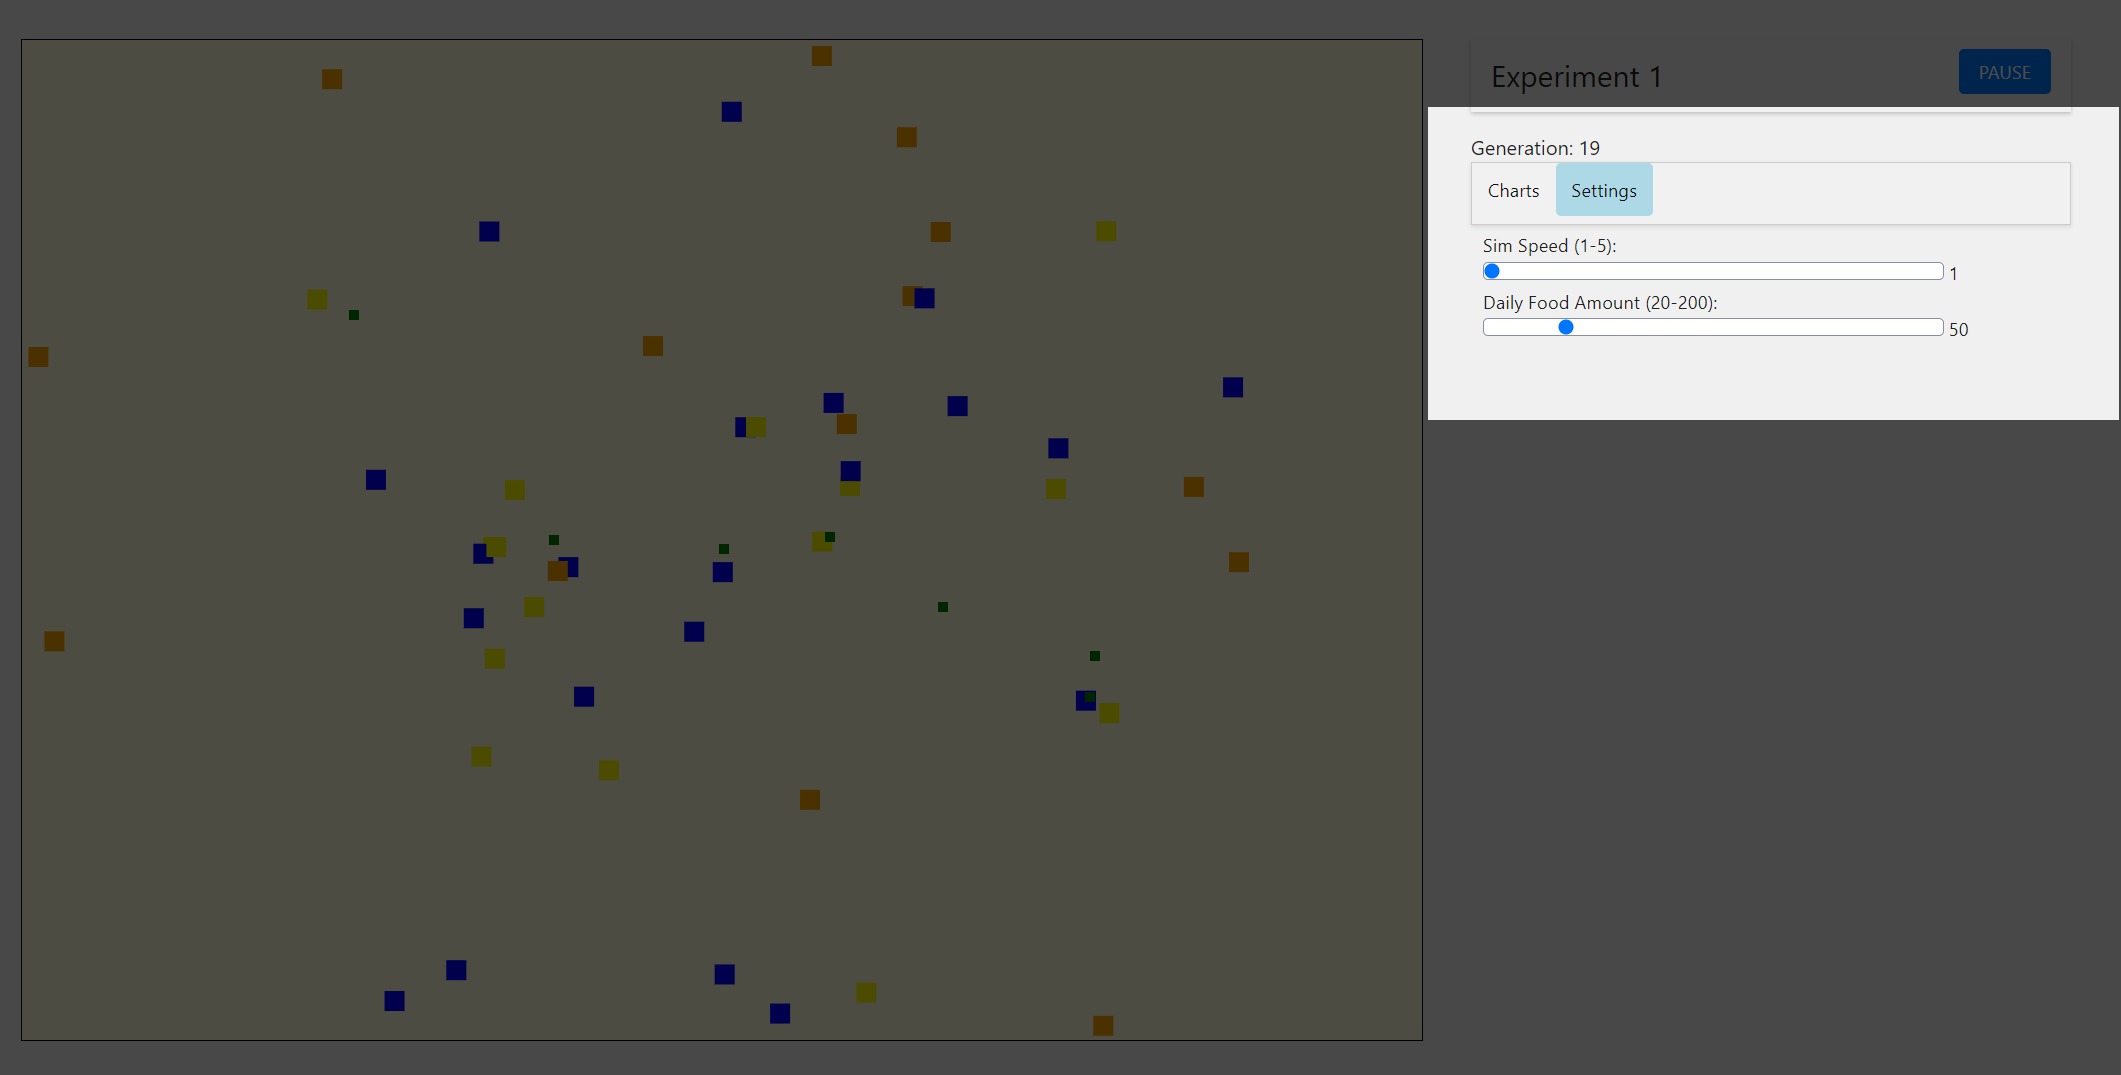
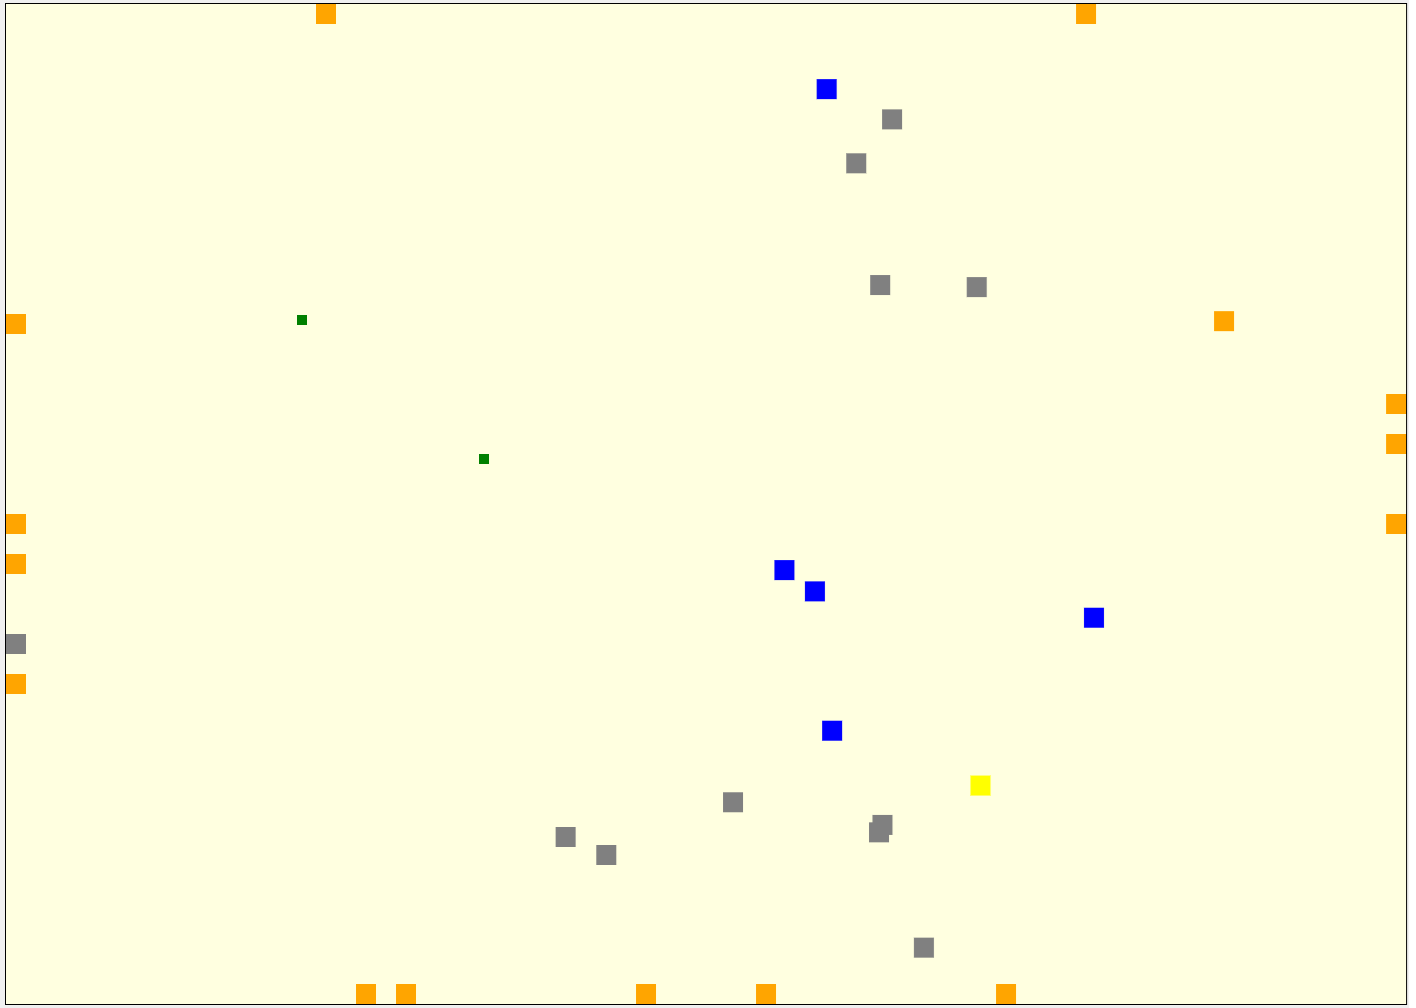
In this simulation, you are controlling the environment in which slimes and food exist. The slimes move around and consume food to grow. The settings for this simulation can be modified, and different variables are tracked over time.

Blue Square: Represents a slime that has not yet eaten any food.

Yellow Square: Represents a slime that has eaten one food.

Orange Square: Represents a slime that has eaten two foods.

Green Square: Represents food.
Placeholder Image

Experiment Controls

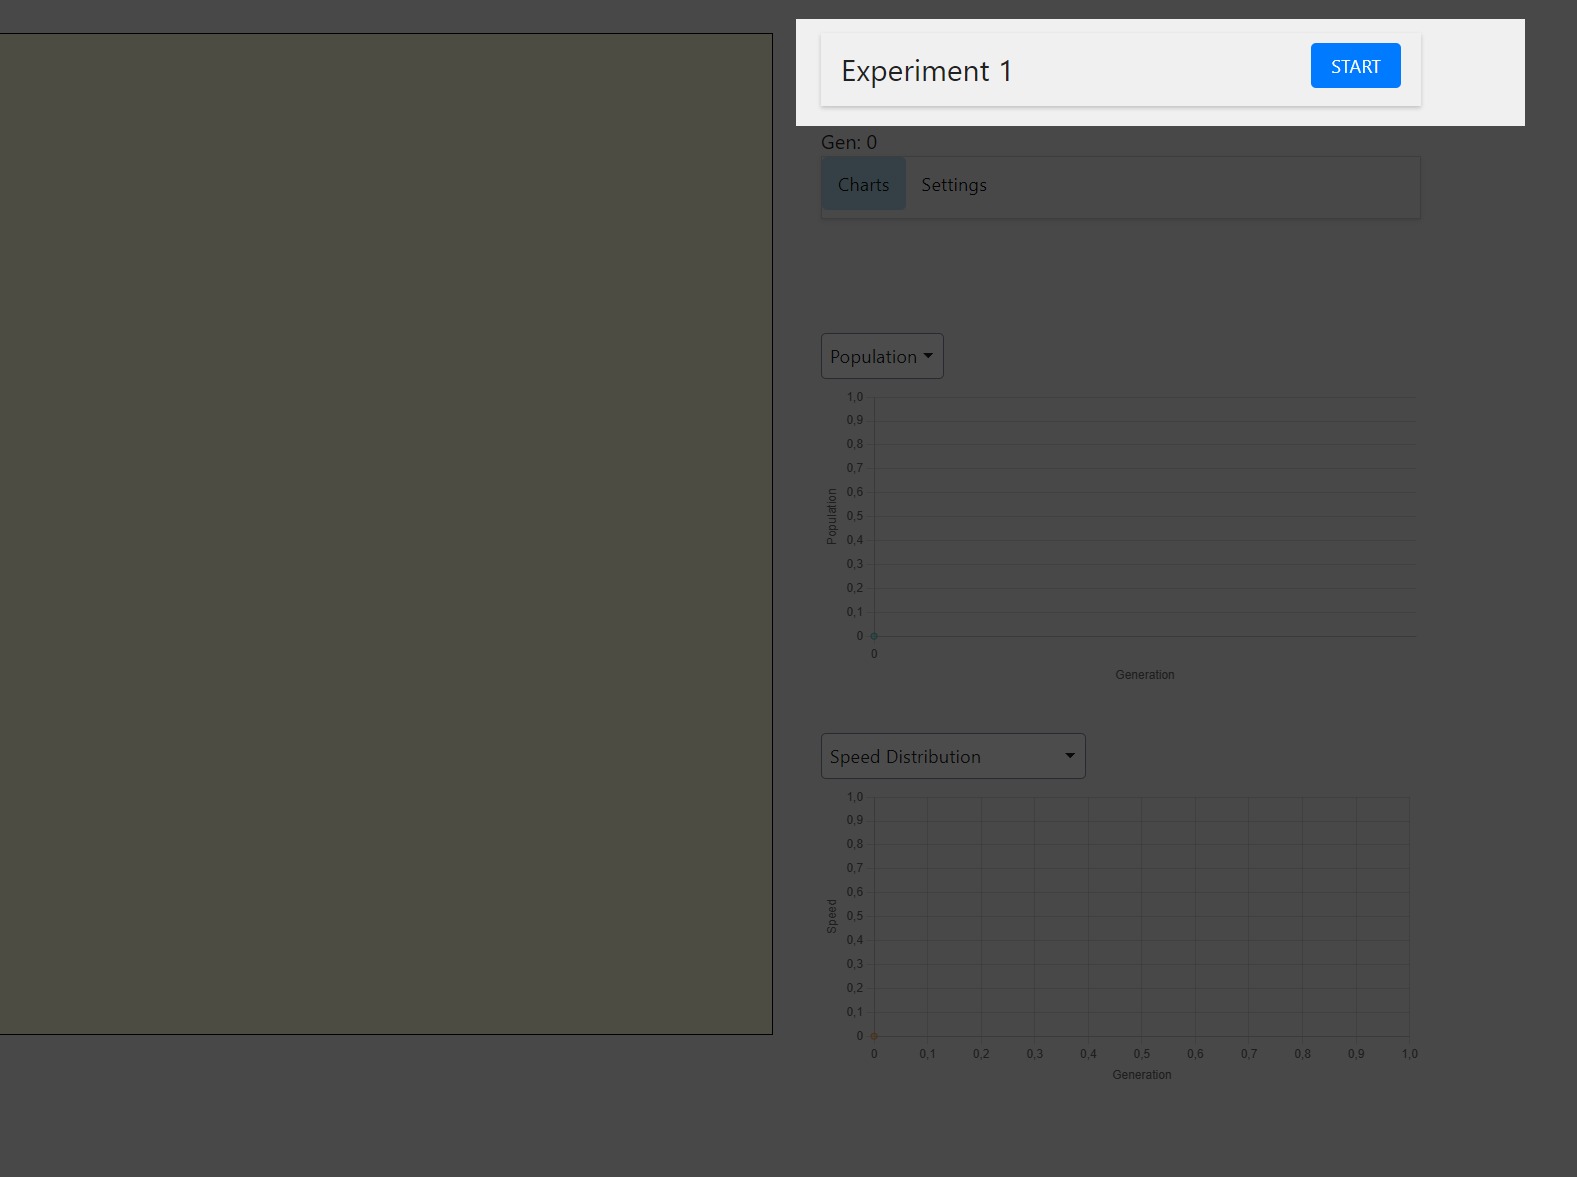
You can start, pause and continue the experiment from the button at the top right corner.

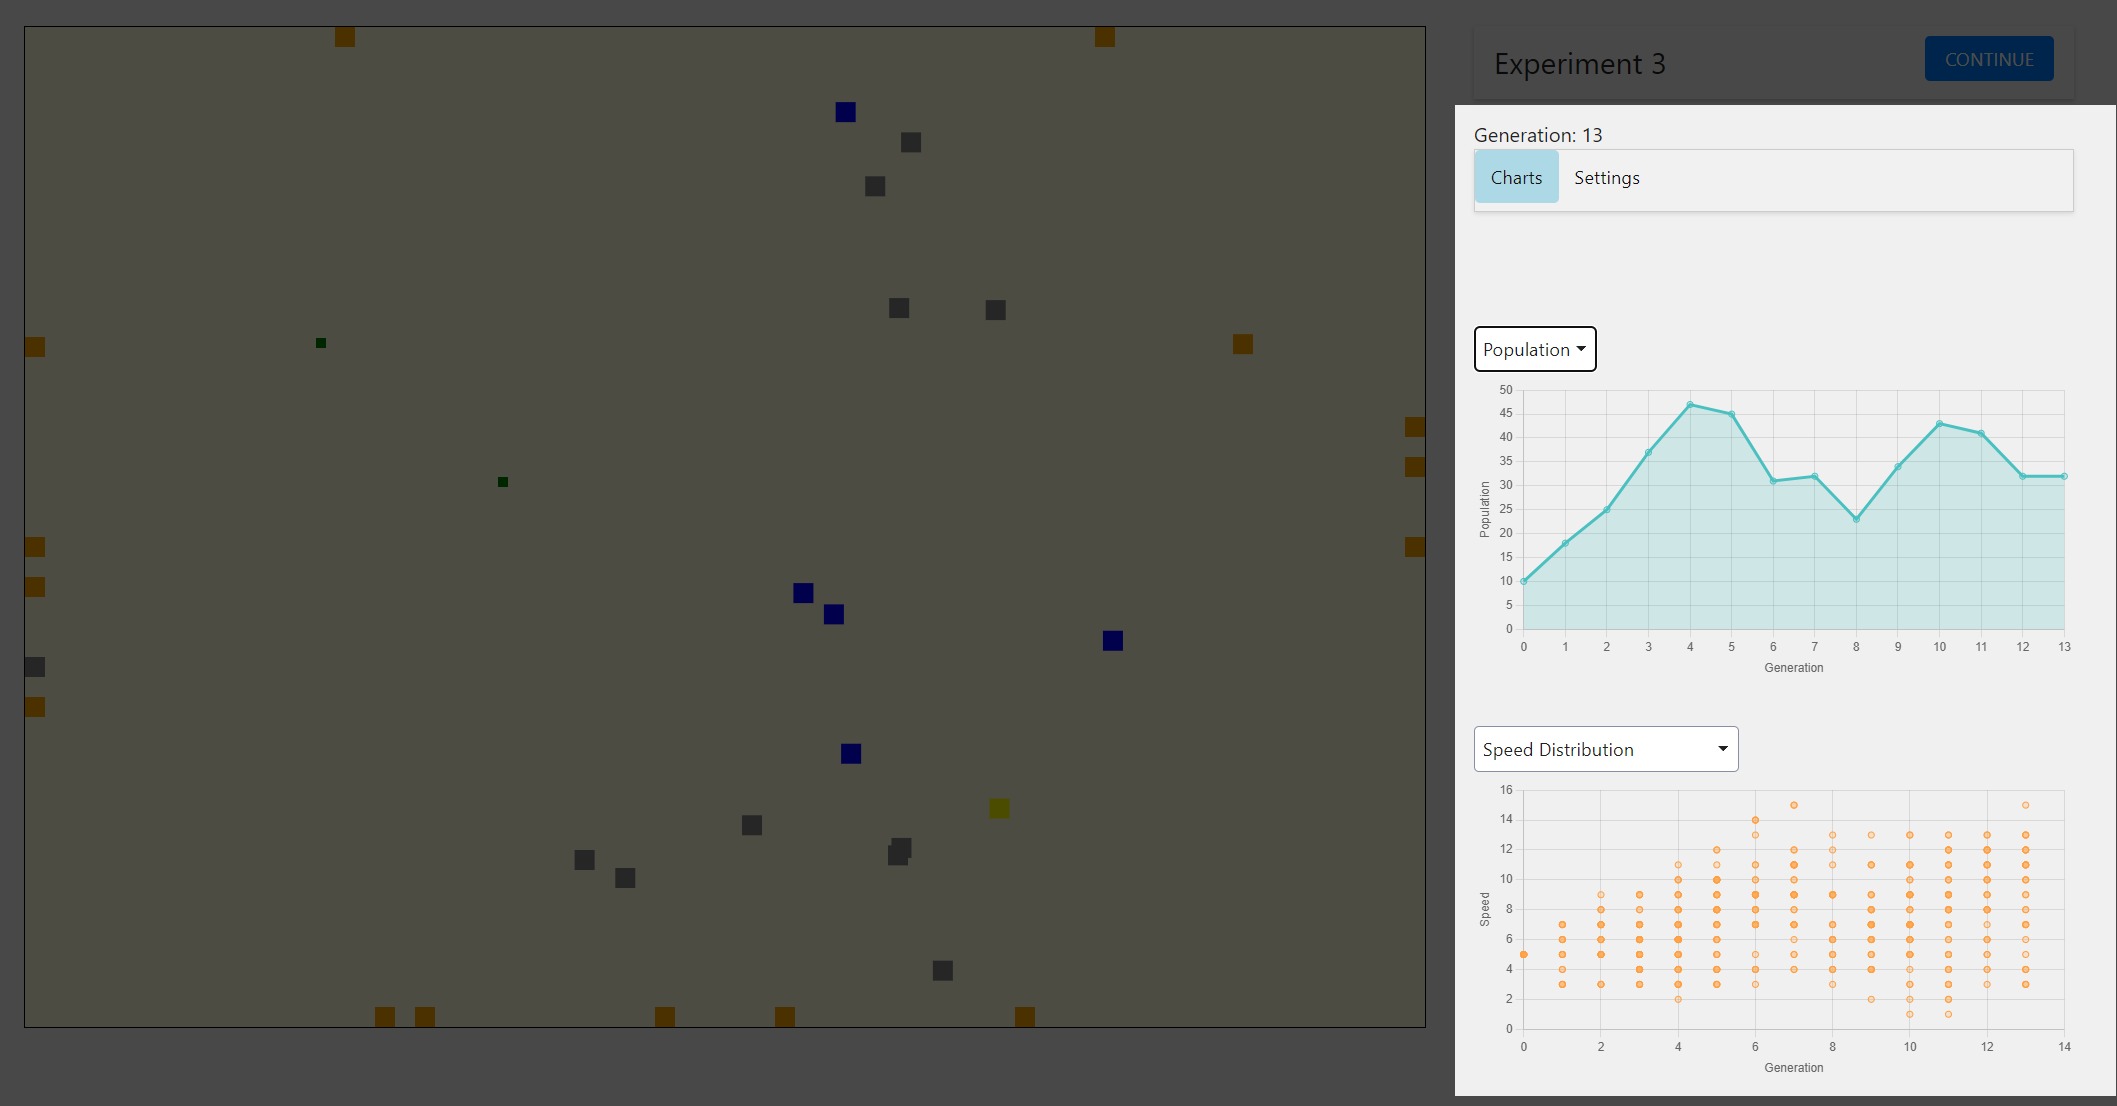
Generation Counter: Shows the current generation of the simulation (e.g., "Generation: 13"). Each generation represents a cycle in which the slimes and food interact.

Placeholder Image

Settings Tab

In the settings tab, you can adjust some of the experiment’s parameters:

Sim Speed: This slider controls the speed of the simulation. Set it to a lower number to slow down the simulation and a higher number to speed it up.

Daily Food Amount: Adjust this slider to set the amount of food that will be spawned daily for the slimes to consume.

Depending on the experiment, there may be other values that can be modified.

Placeholder Image

Charts Tab

Here, you can observe how different variables change over the course of generations. You can select between different data types such as:

Line Chart: On the line chart, you can observe tha average value of selected values

Scatter Plot: Scatter chart shows you the distribution of of the values. Dots for each slime. If the slimes have the same values, dots will be overlapped and look darker.